Web-based open GIS tool for the presentation and management of monitoring and modelled data.

Run the GIS apps via the following links:
The TIMMOD Web-GIS tool incorporates 3 levels of implementation.
|
Pilot test site 1: broader coastal area of Varna, Bulgaria |
 |
|
|
Pilot test site 2: broader coastal area of Batumi, Georgia |
 |
|
| Black Sea Basin |  |
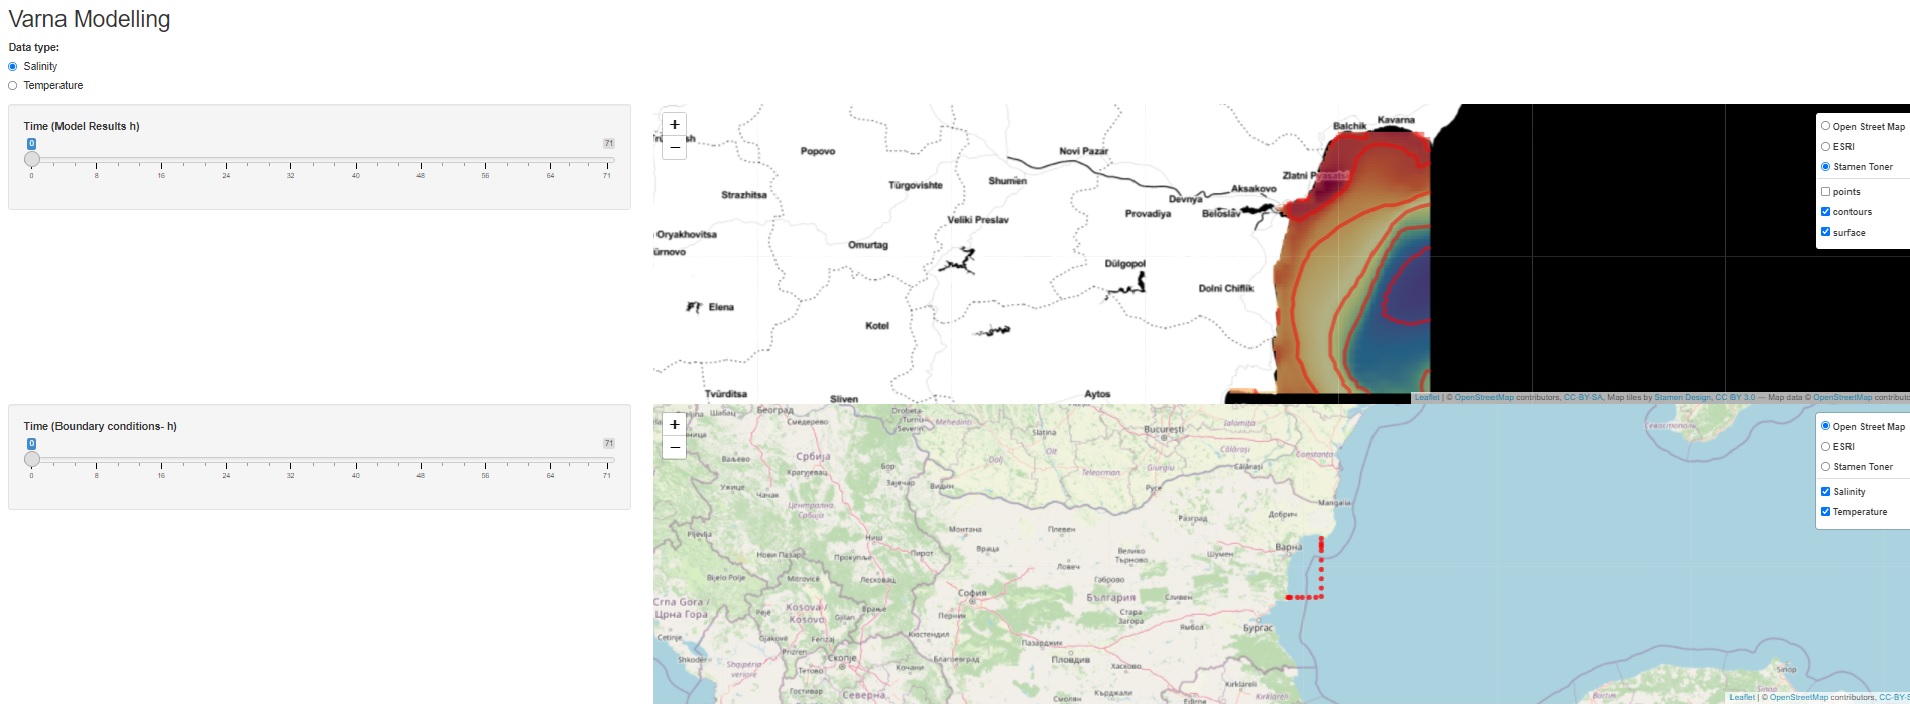
An example of
a) raster fields for BSB seawater Sea Surface Salinity (SSS) and Temperature (SST) with contour surface maps (upper graph), and
b) vertical distributions over the water column on points along the computational domain boundaries (lower graph),
in the Varna coastal area (pilot test case in Bulgarian waters), produced within the TIMMOD OFP for oceanographic modelling, is available:
The programming codes and building process within the R Studio working interface, e.g., arranging lists and relevant data structures in order to group GIS maps, created in Leaflet, are shown in the “Viewer” panel below; application refers to the coastal stations of field monitoring data in the Batumi pilot test within TIMMOD project.
This processing results to the following depiction outcome about Chemical and Phytoplankton parameters (PO4 and NO3 concentrations’ timeseries are shown here) in the Batumi coastal area’s part of the web-GIS app, supported in terms of dataset feeding by the TIMMOD Survey Pilot Demonstrations
For the Varna pilot test site, the TIMMOD web-GIS app offers the following monitoring field georeferenced datasets:
a) dual map representation of physicochemical datasets,
b) abundance of Turbot fish stock by Catch Per Unit Effort (CPUE; kg/km2) in raster mode for 2017,
c) vertical (along the water column) distribution of e.g., pH and other physicochemical parameters in selected field measurement points,
d) SSS and SST point values, e) spatial polygons and spatial points projected for Rapana Venosa fields and Natura2000 areas.


